
tl;dr: Sleeping and attaching a debugger? Meh. Writing copious log files? Meh. In the case of a crashing service, it’s much easier to collect the crashdump and analyze.
Update (July 2020: This post is about using Procdump to automatically collect user- mode crashdumps. If you’d prefer to use in-box functionality, Windows provides an easier way to collect full user-mode dumps. Here’s an excerpt:
Starting with Windows Server 2008 and Windows Vista with Service Pack 1 (SP1), Windows Error Reporting (WER) can be configured so that full user-mode dumps are collected and stored locally after a user-mode application crashes. Applications that do their own custom crash reporting, including .NET applications, are not supported by this feature.
This feature is not enabled by default. Enabling the feature requires administrator privileges. To enable and configure the feature, use the following registry values under the HKEY_LOCAL_MACHINE\SOFTWARE\Microsoft\Windows\Windows Error Reporting\LocalDumps key.
| Value | Description | Type | Default value |
| DumpType | Specify one of the following dump types: 0: Custom dump 1: Mini dump 2: Full dump | REG_DWORD | 1 |
If you’ve spent much time developing Windows Service, you’ve probably run into the case where your service mysteriously crashes while it is starting. In cases like these, Windows isn’t always particularly helpful. For example, here’s what Windows has to say about my Crashy Service:

“The Crashy Service service terminated unexpectedly.” Thanks Windows!
Since the crash is happening during service startup, it’s a little tricky to attach a debugger (or downright impossible in customer environments). Instead, as an exercise, let’s use the Sysinternals procdump tool to collect the crash dump and Visual Studio 2013 to figure out what went wrong.
Here are the steps:
1. We set procdump as the system postmortem debugger using the -i flag. This allows procdump to write out the state of the process before it crashes.

2. Now we reproduce the service startup crash. Before the service crashes, procdump will write the crashdump to the directory where we ran the -i command in the previous step.
3. (Optional) Revert the system postmortem debugger to the previous value using the procdump -u command.

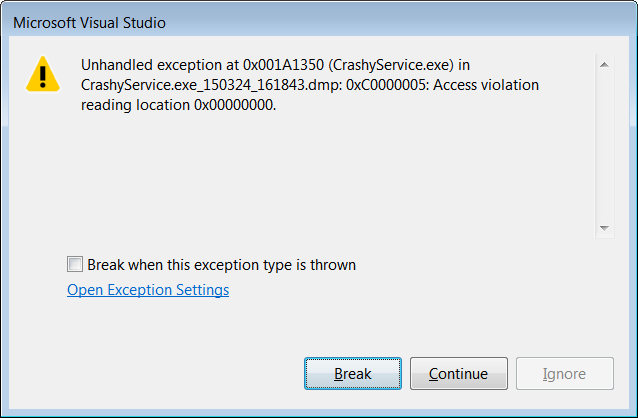
4. Open the .dmp crashdump file in Visual Studio 2013. When I do this, I see an initial screen that tells me a bit more about the exception that led to the crash. I then have the option of digging into the crashdump via the “Debug with Native Only” action.


5. When I click on Debug with Native Only, I get access to the call stack as well as the exact line of code that caused the crash (give or take — nobody’s perfect!) In this case it appears that I’m trying to lower case a null string, which throws an access denied exception.

More info: I’m analyzing the binary on the same machine where I compiled it. In other situations, you will have to tell VS where your symbols are. Also, in general I would probably use WinDbg to analyze the crashdump as I have way more experience with it. !analyze -v is your friend.

What if a service, set to Automatic start, is BSOD’ing at system startup — but doesn’t BSOD when set to Manual and launched “by hand” AFTER the system is up and running? What if a service fails to start (even when done manually), but doesn’t BSOD or (as far as I know) produce a dump? All of this on built-in services for which I don’t have source code, on a machine which doesn’t have VS 2013 or WinDbg and can’t get either of them?
1. If your service is crashing at system service startup, you can use the article here to set the system up for automatic user-mode dump collection: https://docs.microsoft.com/en-us/windows/win32/wer/collecting-user-mode-dumps . You need to retrieve the dump somehow and then analyze on a machine with WinDbg.
2. If the service fails to start but doesn’t crash, I’d start with the Event Viewer. There’s usually an error code as to what went wrong.